Natural Language Dashboards: Is This the End of Filters?
Natural Language Dashboards: Is This the End of Filters?
For nearly two decades, dashboards have been the backbone of business intelligence. Every metric, KPI, and visual insight has depended on one universal mechanism: filters. Date filters, category filters, product filters, region filters – business users have spent more time tweaking filters than analyzing insights.
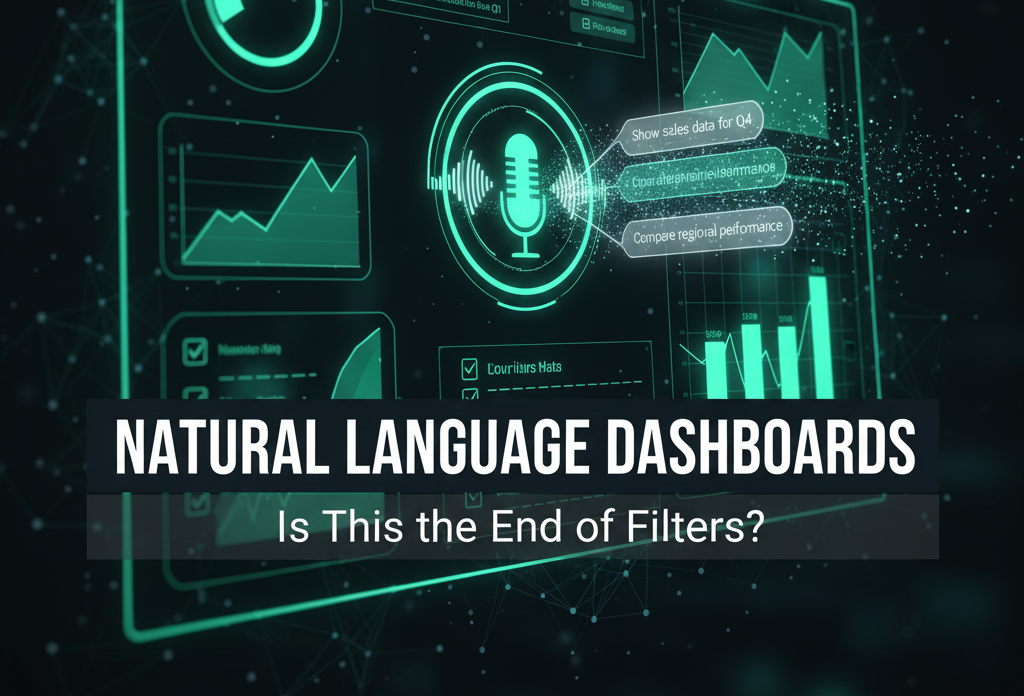
But the rise of natural language interfaces (NLI) and Generative AI-driven analytics is rewriting the rules. The new wave of natural language dashboards allows users to simply ask a question – and get the answer instantly, without clicking through dropdowns or adjusting slicers.
This shift raises an inevitable question:
Is this the end of filters?
As organizations adopt next-generation BI tools that understand plain English (or Arabic, or any language they operate in), the traditional way of interacting with dashboards is being challenged. Filters, once a necessity, are losing relevance in a world where data responds to conversation, not clicks.
For business leaders – especially in data-rich industries across the GCC and KSA – this transition is not just a UX improvement. It’s a fundamental rethinking of how analytics should work.
The Problem with Filters: Why Users Struggle
Filters were created as a way to give users control. But over the years, they have become a burden:
1. Too Many Filters Lead to Cognitive Overload
Dashboards have evolved from simple reports to dense analytical canvases. With dozens of filters – time, segments, categories, countries, channels – users get overwhelmed before they even start analyzing.
2. Filters Require Training
Non-technical users must often be trained to:
-
Understand hierarchy (e.g., country vs. region vs. city)
-
Use date filters properly
-
Apply multiple filters without breaking the dashboard
-
Know which filters influence which charts
This slows down decision-making and increases dependency on analysts.
3. Filters Slow Down Exploration
Users tend to stick to familiar filter combinations:
-
“Last month”
-
“Top 10 customers”
-
“By region”
They rarely explore deeper layers like product profitability per branch per shift – because it requires tedious, multi-step filtering.
4. Filters Create ‘Static Thinking’
A dashboard is often built around assumptions:
-
These dimensions matter
-
These metrics are relevant
-
These slices are most used
Filters can’t help users think outside what the dashboard designer imagined.
Enter Natural Language Dashboards
Natural language dashboards use:
-
Large Language Models (LLMs)
-
Semantic data layers
-
Conversational query engines
-
Generative visualization tools
…to let users interact with data as if they were speaking to an analyst on their team.
Instead of:
Click → Filter → Select → Refresh → Adjust
You simply type or say:
“Show sales growth in Riyadh last quarter by customer type. Highlight the top 5.”
And the dashboard produces:
-
The right chart
-
The correct aggregation
-
The filtered view
-
Insights, anomalies, or summaries
Almost instantly.
How Natural Language Dashboards Work
Natural language dashboards rely on a combination of technologies:
1. Semantic Layer
A unified model that understands concepts like:
-
“Sales” = total revenue
-
“Top customers” = highest value by sales
-
“Churn” = customers inactive for X days
This makes business questions interpretable.
2. Natural Language Understanding (NLU)
The system translates user questions into:
-
SQL
-
DAX
-
MDX
-
BigQuery SQL
-
Spark queries
Depending on backend data platforms.
3. Generative Visualization
Charts are not pre-designed.
The system chooses:
-
Bar vs line vs table vs scatter
-
Granularity
-
Groupings
-
Color logic
Based on the nature of the question.
4. Real-Time Analytics Engine
If the question is:
“What changed in the last 24 hours?”
The dashboard triggers a fresh query and builds visuals on the fly.
5. Explanatory AI
Beyond charts, AI adds:
-
Commentary
-
Highlights
-
Correlations
-
Alerts
-
Predictions
Suddenly, dashboards talk back.
Why Natural Language Dashboards Are Replacing Traditional Filters
1. They Remove the Need for Navigating Complex Filter Trees
Users no longer need to know:
-
Which filter exists
-
How to apply it
-
Which chart it affects
They ask:
“Compare performance between Jeddah and Dammam for Q1.”
The dashboard handles the rest.
2. They Enable Instant Deep-Dive Analysis
Filters limit thinking.
Natural language expands it.
Example:
“Break this down by hour of the day and show anomalies.”
A human would need dozens of filter clicks.
AI needs one instruction.
3. They Understand Ambiguity
Humans speak in incomplete language:
“Show last year performance”
AI knows whether the user means:
-
Fiscal year
-
Calendar year
-
Rolling 12 months
Traditional filters never guess.
4. They Speed Up Decision-Making
Executives get answers within seconds – no dashboard literacy required.
This is especially valuable for KSA Vision 2030 verticals where data democratization is a priority:
-
Healthcare
-
Retail
-
Manufacturing
-
Energy
-
Logistics
-
Government
5. They Empower Non-Technical Teams
Sales, operations, finance, HR – anyone can use data without training.
This is data democratization, the core promise of modern analytics.
Does This Mean Filters Are Dead? Not Exactly.
Despite the hype, filters will not disappear entirely.
Instead, they will take a new role.
1. Filters Become ‘Under the Hood’ Tools
Users will not interact with filters directly.
AI will use them to execute requests.
2. Filters Become Guardrails
Organizations may still need:
-
Mandatory filters for data privacy
-
Time-range defaults
-
Region-level restrictions
3. Filters Remain Useful for Repetitive Tasks
For dashboards that are:
-
Operational
-
High-frequency
-
Standardized
…filters continue to be efficient.
Example:
A supply chain manager viewing daily shipments may still prefer clicking “Yesterday.”
4. Filters Still Matter for Power Users & Analysts
Analysts may still:
-
Combine filters manually
-
Build reusable query sets
-
Inspect slices in detail
Natural language dashboards enhance their work – not replace it.
The Real Shift: From ‘Filter First’ to ‘Ask First’
The big transformation is not about the death of filters.
It’s about the death of filter-first analytics.
In the old world:
-
Go to dashboard
-
Identify correct filters
-
Adjust them
-
Interpret charts
-
Repeat
In the new world:
-
Ask a question
-
Get the answer
-
Ask follow-up questions
-
Receive explanations, insights, and predictions
-
Iterate continuously
This is analytics without friction.
Why This Shift Matters in KSA and GCC Markets
Many organizations in the GCC are undergoing rapid digital transformation.
But they still face challenges:
-
Low dashboard adoption among business units
-
Heavy dependency on BI teams
-
Slow turnaround for ad-hoc questions
-
Difficulty interpreting complex visuals
-
Executives demanding faster insights
Natural language dashboards solve all these issues by providing:
-
Smart, automated insights
-
Conversational exploration
-
Multilingual support (English + Arabic)
-
Accessibility for non-technical users
-
Faster time-to-insight
-
Higher engagement
For KSA’s booming industries – retail, energy, fintech, telecom, government – this is a major leap in enabling a data-driven workforce.
Use Cases: What Natural Language Dashboards Deliver
1. Retail
Ask:
“Why did sales drop in Riyadh last weekend?”
The dashboard replies with:
-
Footfall drop
-
Weather impact
-
Promotions ending
-
Stockout alerts
2. Manufacturing
Ask:
“Show machine downtime trends for Line 3 over the last 7 days.”
AI responds with:
-
Root cause: sensor failure
-
Predictive alert: 84% chance of recurring
-
Visual chart: downtime by shift
3. Financial Services
Ask:
“Which customer segments are showing early signs of churn?”
The dashboard identifies patterns and risk zones.
4. Logistics
Ask:
“Estimate delivery delays for this week due to port congestion.”
AI blends:
-
External data
-
Historical data
-
Predictions
The Future: AI-First Dashboards
Within the next 2–3 years, dashboards will evolve into AI-first analytical assistants, capable of:
-
Auto-generating dashboards
-
Predicting what users want to see
-
Triggering alerts without being asked
-
Automatically rewriting visuals based on trends
The dashboard becomes alive.
We are moving from:
-
Static dashboards → Dynamic insights
-
Manual filters → Automated intelligence
-
Visual exploration → Conversational analytics
This is the future of business intelligence.
How Datahub Analytics Helps Organizations Adopt Natural Language Dashboards
Datahub Analytics supports enterprises and government sectors across the Middle East in transforming their BI landscape with:
1. Generative BI Implementations
Power BI, Tableau, Looker, Qlik integrations with LLM-driven capabilities.
2. Natural Language Query Systems
Building semantic layers + LLM connectors for enterprise data.
3. AI-Driven Dashboard Automation
Automated chart generation, anomaly detection, and insight summaries.
4. Self-Service Analytics Enablement
Helping teams adopt conversational analytics with no technical background.
5. Governance, Data Quality, and Security
Ensuring AI analytics remain:
-
Accurate
-
Secure
-
Compliant
-
Explainable
Whether you’re deploying a new BI platform or modernizing an existing one, we help you build analytics that talk, not just display.
Conclusion: Filters Won’t Disappear – But They Won’t Drive Analytics Anymore
Filters will always exist in some form.
But they will no longer be the central way people interact with data.
Natural language dashboards introduce a new paradigm:
-
Faster
-
Smarter
-
More intuitive
-
More democratic
This is not just UX evolution – it’s analytics transformation.
In the end, the question isn’t whether filters will end.
It’s whether businesses are ready to adopt AI-driven, conversational, insight-first analytics that unlock true data value.