
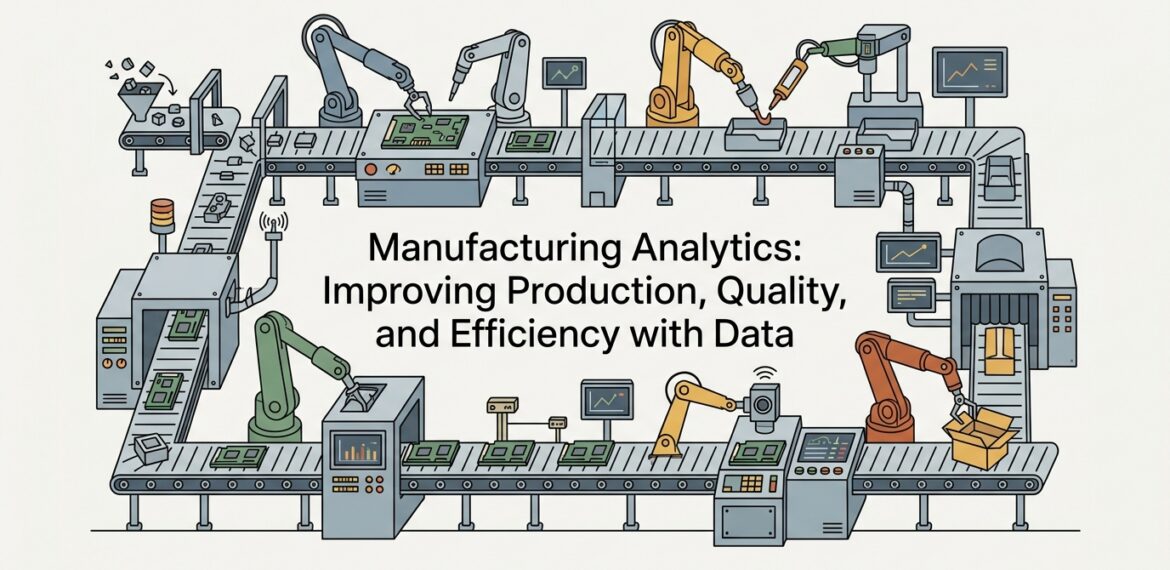
Manufacturing Analytics: Improving Production, Quality, and Efficiency with Data
Manufacturing Analytics: Improving Production, Quality, and Efficiency with Data
 Datahub Analytics Team
Manufacturing businesses operate in a complex environment.
They must manage production schedules, equipment performance, raw materials, workforce availability, supplier reliability, quality standards, delivery timelines, energy usage, and cost control. A delay in one area can affect the entire operation. A machine breakdown can slow production. Poor demand planning can create excess inventory. Quality issues can increase rework and waste. Inefficient resource usage can reduce margins.
For manufacturers in Saudi Arabia, these challenges are especially important as the Kingdom continues to expand industrial development, local production, logistics capabilities, and economic diversification. Manufacturing companies are expected to become more efficient, more digital, and more competitive.
Manufacturing analytics helps businesses achieve this.
It turns production, machine, quality, supply chain, inventory, workforce, and finance data into practical insight. With the right analytics foundation, manufacturers can improve output, reduce waste, predict equipment issues, optimize production planning, and make faster operational decisions.
What Is Manufacturing Analytics?
Manufacturing analytics is the use of data, business intelligence, visualization, and advanced analytics to improve manufacturing performance.
It brings together data from production systems, machines, sensors, ERP platforms, quality systems, maintenance tools, inventory systems, supply chain platforms, workforce systems, and finance applications.
The goal is to give manufacturers better visibility into how operations are performing and where improvements are needed.
From Production Reports to Operational Intelligence
Traditional manufacturing reports often show basic production numbers.
How many units were produced?
How many defects were recorded?
How much downtime occurred?
How much inventory is available?
These reports are useful, but they often explain what happened after the fact.
Manufacturing analytics goes deeper. It helps teams understand why production slowed, which machines are underperforming, where quality problems are happening, which materials are creating delays, and how future output can be planned better.
This helps manufacturers move from reporting to active operational intelligence.
Connecting Factory, Supply Chain, and Finance Data
Manufacturing performance is connected across many areas.
Production depends on raw materials, machine availability, labor, maintenance, demand, and scheduling. Quality affects rework, waste, customer satisfaction, and cost. Inventory affects working capital and delivery performance. Energy usage affects operating cost. Finance depends on production efficiency, material cost, and margin.
Manufacturing analytics connects these areas into one clearer view.
This helps leaders understand how operational decisions affect business performance.
Why Manufacturing Analytics Matters
Manufacturers face pressure to increase output, improve quality, reduce cost, and respond faster to demand changes.
Without analytics, many decisions depend on manual reports, delayed updates, spreadsheets, or individual experience. While experience is valuable, it becomes more powerful when supported by reliable data.
Production Needs Real-Time Visibility
Manufacturing operations can change quickly.
A machine may slow down. A material shortage may stop a line. A quality issue may appear during a shift. A supplier delay may affect the next production batch.
If teams discover these issues too late, the impact becomes larger.
Manufacturing analytics gives teams faster visibility into production status, machine performance, downtime, output, and bottlenecks.
This helps supervisors and managers respond earlier.
Quality Issues Are Expensive
Quality problems create direct and indirect costs.
They can lead to rework, scrap, warranty claims, delayed delivery, customer dissatisfaction, and reputational damage.
Manufacturing analytics helps identify where quality issues occur and why.
It can show defects by line, machine, operator, batch, supplier, material, product, or shift. This helps quality teams focus improvement efforts on the real causes.
Downtime Reduces Capacity
Unplanned downtime is one of the biggest challenges in manufacturing.
When equipment fails, production stops. Teams may lose time, miss targets, increase overtime, delay shipments, or incur repair costs.
Analytics helps monitor equipment performance and detect early warning signs.
With predictive maintenance, manufacturers can reduce unexpected breakdowns and plan maintenance more effectively.
Cost Control Requires Operational Detail
High-level cost reports do not always show where inefficiency exists.
Costs may increase because of waste, downtime, energy usage, overtime, supplier delays, poor scheduling, low yield, or excess inventory.
Manufacturing analytics helps connect cost with operational activity.
This gives leaders a clearer view of where margins are affected.
Key Areas of Manufacturing Analytics
Manufacturing analytics can support many operational and business decisions. The strongest value comes when production, quality, maintenance, inventory, supply chain, and finance data are connected.
Production Performance Analytics
Production analytics helps manufacturers monitor output, cycle time, throughput, line performance, shift performance, and production target achievement.
It can show which lines are meeting targets and which are falling behind.
This helps production managers identify bottlenecks and improve planning.
For example, if one line consistently produces below target, analytics can help determine whether the issue is machine speed, material availability, operator capacity, maintenance, or scheduling.
Machine and Equipment Analytics
Machine analytics tracks equipment performance, usage, downtime, operating speed, energy consumption, and maintenance history.
This helps teams understand which machines are performing well and which need attention.
For manufacturers using connected machines or IoT sensors, analytics can provide deeper visibility into temperature, vibration, pressure, load, speed, and other performance indicators.
This supports predictive maintenance and better asset utilization.
Downtime Analytics
Downtime analytics helps manufacturers understand when and why production stops.
It can track downtime by machine, line, shift, reason code, product type, maintenance event, or operator group.
This helps identify recurring problems.
For example, downtime may be caused by equipment failure, material shortage, changeover time, cleaning, quality inspection, or staffing issues.
Once the causes are clear, teams can prioritize improvements.
Quality Analytics
Quality analytics helps monitor defects, rework, scrap, inspection results, customer complaints, and product compliance.
It can show quality issues by product, production line, supplier, batch, machine, material, or shift.
This helps quality teams find patterns.
If one supplier’s material is linked to higher defects, procurement can take action. If one machine produces more rework, maintenance can investigate. If one product has recurring complaints, engineering can review the design or process.
Inventory and Material Analytics
Manufacturing depends on the right materials being available at the right time.
Inventory analytics helps monitor raw materials, work-in-progress, finished goods, stock levels, reorder points, aging inventory, and material usage.
This helps manufacturers reduce both shortages and excess stock.
Material analytics also helps identify wastage, usage variance, and procurement planning issues.
Supply Chain Analytics
Manufacturing supply chains can involve many suppliers, logistics providers, warehouses, and production dependencies.
Supply chain analytics helps track supplier lead times, delivery reliability, purchase order status, material availability, and logistics delays.
This is important for manufacturers in Saudi Arabia that depend on both local and international suppliers.
Better supply chain visibility helps reduce production interruptions.
Energy Analytics
Manufacturing facilities often consume significant energy.
Energy analytics helps monitor energy consumption by facility, line, machine, process, or time period.
This helps identify inefficient equipment, peak consumption periods, and opportunities for optimization.
For energy-intensive industries, this can create significant cost savings.
Workforce and Shift Analytics
Production performance is also affected by workforce planning.
Workforce analytics can show shift productivity, attendance, overtime, skill availability, training needs, and labor allocation.
This helps plant managers plan shifts more effectively and identify areas where training or staffing changes may be needed.
Cost and Margin Analytics
Manufacturing profitability depends on production cost, material cost, labor cost, energy cost, rework, waste, and delivery cost.
Cost analytics helps leaders understand the true cost of products, batches, lines, plants, and customers.
This supports better pricing, planning, and margin control.
The Data Foundation for Manufacturing Analytics
Manufacturing analytics depends on accurate and connected data.
If production, quality, maintenance, supply chain, and finance data remain separate, teams may not see the full cause of performance issues.
Connecting Production and Business Systems
Manufacturing data may come from ERP systems, manufacturing execution systems, SCADA systems, IoT sensors, machine logs, quality systems, maintenance platforms, warehouse systems, procurement tools, and finance applications.
Connecting these systems creates a complete view of the manufacturing operation.
For example, a production delay may be linked to supplier delay, inventory shortage, machine downtime, workforce availability, or quality hold. Without connected data, the root cause may remain hidden.
Modern Data Warehouse for Manufacturing
A modern data warehouse provides a structured foundation for manufacturing analytics.
It brings data from multiple systems into one analytics environment. This supports dashboards, production monitoring, predictive models, quality analysis, and cost reporting.
Without a modern data warehouse, manufacturers often depend on spreadsheets, manual reports, and disconnected system exports.
This slows analysis and reduces trust in the numbers.
Business-Ready Manufacturing Data Models
Manufacturing data should be modeled around useful business entities.
These may include products, production lines, machines, batches, shifts, materials, suppliers, work orders, quality inspections, maintenance events, warehouses, and costs.
When data is organized clearly, reporting becomes easier and more useful.
Data Quality and Standardization
Manufacturing analytics requires reliable data.
Incorrect machine IDs, missing downtime reasons, inconsistent product codes, delayed quality records, or incomplete maintenance logs can affect analysis.
Businesses need data quality checks, standardized definitions, and clear reporting processes.
Good analytics depends on good data discipline.
Business Intelligence for Manufacturing Analytics
Business intelligence helps manufacturing teams turn operational data into dashboards and decision tools.
Different users need different views.
Executive Manufacturing Dashboard
Executives need a high-level view of production performance.
This may include output, utilization, downtime, quality, cost, inventory, supplier risk, energy usage, and margin.
The dashboard should highlight performance trends and major issues clearly.
Plant Operations Dashboard
Plant managers need daily visibility into production lines, shift performance, machine status, downtime, and target achievement.
This helps them manage operations in real time or near real time.
Quality Dashboard
Quality teams need visibility into defects, rework, scrap, inspection results, customer complaints, and supplier-related quality issues.
This helps them prioritize corrective actions.
Maintenance Dashboard
Maintenance teams need visibility into machine health, downtime, planned maintenance, unplanned breakdowns, maintenance backlog, and asset performance.
This supports better maintenance planning.
Inventory and Supply Dashboard
Supply chain teams need visibility into raw materials, work-in-progress, finished goods, supplier deliveries, and stockout risk.
This helps prevent production interruptions.
Cost Dashboard
Finance and operations teams need visibility into product cost, material cost, labor cost, energy cost, waste, and margin.
This helps improve cost control and profitability.
How Data Science Improves Manufacturing Analytics
Data science can help manufacturers move from monitoring to prediction and optimization.
Predictive Maintenance
Predictive maintenance uses machine data to identify equipment that may fail or require service.
Models can analyze vibration, temperature, pressure, runtime, maintenance history, and past failure patterns.
This helps teams plan maintenance before breakdowns occur.
Predictive maintenance can reduce downtime, improve asset life, and lower repair cost.
Demand Forecasting
Demand forecasting helps manufacturers plan production more accurately.
Models can use historical sales, customer orders, seasonality, market trends, promotions, and external signals.
Better demand forecasting helps reduce both excess inventory and missed sales.
Quality Prediction
Data science can help predict quality issues before they become widespread.
Models may identify patterns between materials, machine settings, environmental conditions, operators, batches, and defect rates.
This helps quality teams intervene earlier.
Production Optimization
Advanced analytics can identify optimal production schedules, machine settings, batch sizes, and resource allocation.
This helps improve throughput and reduce waste.
Energy Optimization
Data science can identify energy consumption patterns and recommend efficiency improvements.
This may include adjusting machine schedules, identifying inefficient assets, reducing idle time, or shifting workloads away from peak demand periods.
Manufacturing Analytics and Automation
Manufacturing analytics becomes more valuable when connected with automation.
Analytics identifies the signal. Automation helps trigger action.
Automated Downtime Alerts
If a machine stops or performance drops below threshold, alerts can notify supervisors or maintenance teams.
This reduces response time.
Quality Workflow Automation
If defect rates increase, a workflow can create an inspection task, notify quality teams, or hold a batch for review.
This helps prevent defective products from moving further.
Inventory Replenishment Alerts
If raw material falls below reorder level, alerts can notify procurement or supply chain teams.
This reduces the risk of production stoppage.
Maintenance Workflows
If a machine shows early signs of failure, a maintenance request can be created automatically.
This connects predictive analytics with practical execution.
RPA for Manufacturing Reporting
Robotic Process Automation can support repetitive reporting tasks such as production summaries, quality reports, inventory updates, supplier follow-ups, and finance reporting.
This reduces manual effort and improves consistency.
Common Mistakes in Manufacturing Analytics
Manufacturing analytics can create strong value, but only when implemented carefully.
Looking Only at Output
Production output is important, but it does not explain efficiency.
Manufacturers also need to track downtime, quality, waste, cost, maintenance, energy, and material availability.
Not Connecting Quality and Production Data
Quality issues often have production causes.
If quality data is separate from machine, batch, material, and shift data, root cause analysis becomes difficult.
Ignoring Downtime Reasons
Knowing that downtime happened is not enough.
Teams need accurate reason codes and context to prevent recurrence.
Using Delayed Reports for Fast Decisions
Production decisions often need timely data.
If reports arrive too late, teams cannot act quickly.
Creating Dashboards Without Ownership
A dashboard that shows poor machine performance is useful only if someone is responsible for investigating and resolving the issue.
Analytics should connect insight with action.
A Practical Roadmap for Manufacturing Analytics
Manufacturers can build analytics capabilities step by step.
Define Priority Use Cases
Start with the most important operational questions.
Where is downtime increasing?
Which products have the highest defect rate?
Which machines are underperforming?
Where is material shortage affecting production?
Which lines have the highest cost?
Where is energy usage inefficient?
These questions guide the roadmap.
Connect Core Manufacturing Systems
Connect ERP, production systems, machine data, quality systems, maintenance platforms, inventory systems, supplier data, and finance systems.
This creates the foundation for reliable analytics.
Build Manufacturing Data Models
Create structured models around products, machines, lines, batches, shifts, work orders, materials, suppliers, quality inspections, maintenance events, and costs.
This makes reporting and analysis easier.
Create Role-Based Dashboards
Different teams need different dashboards.
Executives need business performance. Plant managers need operations visibility. Quality teams need defect analysis. Maintenance teams need asset health. Finance teams need cost insight.
Add Predictive Analytics
Once the foundation is ready, add predictive maintenance, demand forecasting, quality prediction, production optimization, and energy analytics.
Connect Insights to Action
Use alerts, workflows, RPA, and automated reporting to turn analytics into operational improvement.
How Datahub Analytics Can Help
Datahub Analytics helps manufacturers build analytics capabilities that improve production performance, quality, cost control, and operational efficiency.
Through its Datahub Analytics services, the company supports big data analytics, modern data warehouse development, business intelligence, data visualization, data science, and robotic process automation. These capabilities help manufacturers connect operational data, build dashboards, forecast demand, predict maintenance needs, monitor quality, and automate reporting workflows.
Datahub Infrastructure supports the technical foundation required for manufacturing analytics through big data infrastructure, containerized infrastructure, DevOps infrastructure solutions, hybrid cloud infrastructure solutions, and managed infrastructure services. This helps organizations build scalable and reliable platforms for high-volume production, machine, sensor, and enterprise data.
For manufacturing organizations in Saudi Arabia and the wider region that need additional delivery capacity, Datahub Outsourcing provides staff augmentation, AI and ML engineers, managed data analytics, data management, PMO services, and Data & Analytics Centre of Excellence support.
By combining analytics, infrastructure, automation, and skilled teams, Datahub Analytics helps manufacturers turn operational data into better decisions and measurable performance improvement.
Conclusion
Manufacturing analytics helps businesses improve production, quality, maintenance, inventory, energy usage, and cost control.
It connects data from machines, production lines, materials, suppliers, quality systems, maintenance tools, finance platforms, and workforce systems into a clearer operational view.
For Saudi manufacturers, analytics is especially relevant as industrial growth, local production, and digital transformation continue to expand.
With the right data foundation, dashboards, predictive models, and automation workflows, manufacturers can reduce downtime, improve quality, optimize resources, and operate more efficiently.
For businesses that want stronger production performance and long-term competitiveness, manufacturing analytics is a practical and high-impact investment.



