The Art of Data Storytelling: Communicating Insights with Impact
The Art of Data Storytelling: Communicating Insights with Impact
In the age of information, data has become a critical asset for businesses across industries. However, the true value of data lies not just in its collection but in its ability to convey compelling insights that drive decisions and strategies. This is where the art of data storytelling comes into play. Data storytelling involves combining data, narrative, and visuals to communicate insights in a way that resonates with the audience, making complex information accessible and actionable. This blog will explore the principles and techniques of effective data storytelling and provide practical tips for crafting impactful data narratives.
The Importance of Data Storytelling
Data storytelling bridges the gap between raw data and actionable insights. Here’s why it’s essential:
Enhancing Understanding
Data can be overwhelming, especially when presented in large volumes or complex formats. Storytelling simplifies data, breaking it down into digestible pieces and providing context that enhances understanding. By weaving a narrative around data, storytellers make the information relatable and easier to grasp.
Engaging the Audience
Stories have a unique power to engage and captivate audiences. Unlike dry statistics or charts, a well-crafted data story can evoke emotions, spark curiosity, and maintain interest. Engaging stories ensure that the audience remains attentive and absorbs the key messages.
Driving Decision-Making
Decision-makers often rely on data to guide their strategies. However, data alone is not enough; it needs to be interpreted and communicated effectively. Data storytelling presents insights in a clear and compelling manner, helping stakeholders understand the implications and make informed decisions.
Building a Data-Driven Culture
Encouraging a data-driven culture within an organization requires more than just providing access to data. It involves fostering an environment where data is valued and utilized effectively. Data storytelling plays a crucial role in this by making data accessible and demonstrating its impact, thereby promoting a culture of informed decision-making.
Key Elements of Data Storytelling
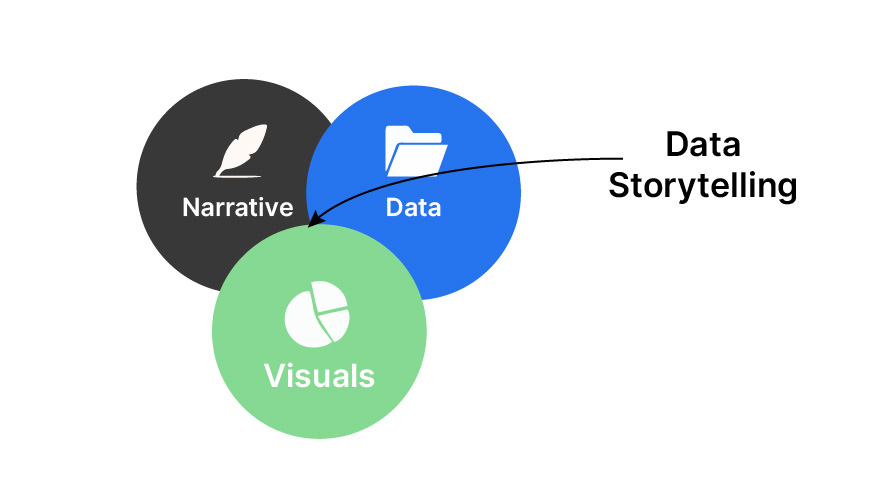
Effective data storytelling combines several key elements: data, narrative, and visuals. Each element plays a critical role in crafting a compelling story.
Data: The Foundation
Data forms the backbone of any data story. It provides the evidence and insights that drive the narrative. To ensure the data is robust and reliable:
- Data Quality: Use accurate, relevant, and up-to-date data. Poor quality data can undermine the credibility of the story.
- Data Analysis: Perform thorough analysis to uncover meaningful patterns, trends, and insights. This involves using statistical techniques, data mining, and other analytical methods.
- Context: Provide context for the data. Explain the source, scope, and limitations to help the audience understand its relevance and significance.
Narrative: The Story
The narrative is what transforms data into a story. It provides the structure and flow that guide the audience through the data journey. Key components of a strong narrative include:
- Introduction: Set the stage by introducing the main topic or question. Provide background information to establish context and relevance.
- Body: Present the data and insights in a logical and coherent manner. Use a clear structure to ensure the story flows smoothly from one point to the next.
- Conclusion: Summarize the key findings and their implications. Highlight the main takeaways and provide recommendations or next steps.
Visuals: The Enhancement
Visuals enhance the story by making data more engaging and easier to understand. They include charts, graphs, infographics, and other visual elements. Effective visuals should:
- Be Clear and Simple: Avoid clutter and complexity. Use straightforward visuals that clearly convey the key messages.
- Highlight Key Points: Use color, size, and other visual cues to draw attention to important data points or trends.
- Complement the Narrative: Ensure that visuals support and enhance the narrative rather than distracting from it.
Techniques for Effective Data Storytelling
Crafting an impactful data story requires a combination of analytical skills, creativity, and communication prowess. Here are some techniques to help you create compelling data stories:
Know Your Audience
Understanding your audience is crucial for tailoring your data story. Consider the following:
- Audience Needs: Identify what the audience cares about and what information they need. Tailor the story to address their interests and concerns.
- Level of Expertise: Consider the audience’s familiarity with the topic and adjust the complexity of the data and narrative accordingly.
- Preferences: Some audiences may prefer detailed reports, while others might favor concise presentations or interactive dashboards. Choose the format that best suits your audience.
Start with a Question
A compelling data story often begins with a question or problem that needs solving. This approach:
- Sparks Curiosity: Starting with a question engages the audience and makes them curious about the answer.
- Provides Focus: It helps maintain a clear focus throughout the story, ensuring that all data and insights are relevant to the central question.
Build a Narrative Arc
A narrative arc gives your data story structure and direction. It typically includes:
- Setup: Introduce the context and background. Present the central question or problem.
- Rising Action: Present the data and analysis. Uncover patterns, trends, and insights that build towards the conclusion.
- Climax: Highlight the most significant finding or insight. This is the turning point that provides the answer or solution to the central question.
- Resolution: Summarize the key takeaways and their implications. Provide recommendations or next steps.
Use Analogies and Metaphors
Analogies and metaphors can make complex data more relatable and understandable. They help bridge the gap between abstract concepts and everyday experiences. For example, comparing a data trend to a familiar phenomenon can help the audience grasp its significance more easily.
Incorporate Visual Storytelling
Visual storytelling involves using visuals not just as supporting elements but as integral parts of the narrative. Techniques include:
- Storyboarding: Plan the visual elements as part of the overall story. Decide where visuals will be placed and how they will contribute to the narrative.
- Interactive Visuals: Use interactive elements like dashboards or infographics that allow the audience to explore the data themselves.
- Data Visualization Best Practices: Follow best practices for data visualization to ensure clarity and effectiveness. This includes choosing the right chart types, labeling axes, and using appropriate scales.
Leverage Emotional Appeal
While data and logic are essential, emotions play a significant role in how stories are received and remembered. To create an emotional connection with your audience:
- Humanize the Data: Whenever possible, tie data points to real-world examples or personal stories. This can make abstract numbers feel more concrete and relatable.
- Evoke Emotions: Use language and visuals that evoke the desired emotions, whether it’s excitement about a new opportunity, concern over a problem, or inspiration to take action.
Focus on Clarity and Simplicity
Clarity and simplicity are paramount in data storytelling. Complex or cluttered presentations can confuse the audience and dilute the impact of your message. To maintain clarity:
- Avoid Jargon: Use plain language and avoid technical jargon, unless you’re sure your audience is familiar with it.
- Simplify Visuals: Choose the simplest and most effective visualizations to convey your points. Avoid overloading charts with too many data points or intricate designs.
- Highlight Key Messages: Use text, color, and design elements to emphasize the most important insights and conclusions.
Iterate and Refine
Creating an impactful data story often requires several iterations. Gather feedback from colleagues, stakeholders, or test audiences and refine your story based on their input. Pay attention to parts of the story that may be confusing or less engaging and make necessary adjustments.
Tools and Resources for Data Storytelling
Several tools can help you craft compelling data stories by providing powerful data visualization and storytelling capabilities. Here are some popular options:
Data Visualization Tools
- Tableau: A leading data visualization tool that enables users to create interactive and shareable dashboards.
- Power BI: Microsoft’s powerful business analytics tool, which offers robust data visualization and reporting features.
- Google Data Studio: A free tool that allows users to create interactive and customizable dashboards and reports.
Infographic and Design Tools
- Canva: A user-friendly design tool that offers templates and graphics for creating visually appealing infographics.
- Adobe Illustrator: A professional graphic design software for creating detailed and customized visualizations.
Storyboarding and Presentation Tools
- Microsoft PowerPoint: A classic tool for creating presentations, offering various features for incorporating data visuals and narrative elements.
- Prezi: A presentation tool that allows for more dynamic and non-linear storytelling with zoomable canvases.
- Storyboarding Software: Tools like Storyboard can help in planning the visual and narrative elements of your data story.
Case Studies: Effective Data Storytelling in Action
Case Study 1: The Rise of Airbnb
Airbnb effectively uses data storytelling to illustrate its growth and impact on the hospitality industry. By combining user-generated data, visuals, and narratives, Airbnb presents compelling stories that highlight key milestones, user experiences, and market trends. Their reports and presentations often use clear visuals and engaging narratives to communicate complex data in an accessible way, making it easier for stakeholders to understand their success and future potential.
Case Study 2: The New York Times’ COVID-19 Coverage
During the COVID-19 pandemic, The New York Times leveraged data storytelling to provide clear and impactful insights into the spread and impact of the virus. They used interactive maps, charts, and visualizations to track cases, deaths, and vaccination rates, accompanied by narratives that provided context and interpretation. This approach not only informed the public but also helped policymakers make data-driven decisions.
Conclusion: Mastering the Art of Data Storytelling
Data storytelling is a powerful tool for transforming raw data into meaningful insights that can drive decisions and actions. By combining data, narrative, and visuals, you can create stories that resonate with your audience, making complex information accessible and engaging.
To master the art of data storytelling:
- Understand your audience and tailor your story to their needs and preferences.
- Start with a compelling question or problem to engage your audience from the outset.
- Build a clear narrative arc to guide your audience through the data journey.
- Use analogies, metaphors, and emotional appeal to make data relatable and memorable.
- Focus on clarity and simplicity to ensure your message is easily understood.
- Leverage the right tools and continuously iterate based on feedback.
As you refine your data storytelling skills, you’ll be better equipped to communicate insights with impact, fostering a data-driven culture and driving meaningful change within your organization. Whether you’re presenting to executives, stakeholders, or the general public, the ability to tell a compelling data story will set you apart and enhance the effectiveness of your communications.
Ready to elevate your business with the power of compelling data storytelling?
Let us help you transform your data into impactful narratives that drive informed decisions and captivate your audience. Partner with us to unlock the full potential of your data and communicate insights with clarity and impact. Contact us today to start your journey towards mastering the art of data storytelling and see the difference it can make for your business. Let’s create stories that inspire and inform—reach out now!